Blog
For limited partners, navigating the complex world of private equity has become increasingly complicated as less capital has been returned, and many GPs are telling the same story about their fund performance. Without access to more granular performance benchmarks, LPs will struggle to fine-tune their allocations or co-invest in specific deals. Deal-level benchmarks can be crucial for accurately assessing individual investments, identifying top-performing GPs, and making sector allocations that maximize returns while managing risk.
DealEdge, a powerful platform from Bain, is a comprehensive deals database of GP-submitted data, providing in-depth deal-level benchmarks on both cash flow and operating performance. The platform allows investors to look at PE performance at the deal-level in addition to the fund-level. Here are several ways LPs and investors can leverage the platform's proprietary data:
-
Co-Investment Support: DealEdge tracks performance across 570+ subsectors of private equity globally, including buyout, growth, and infrastructure managers. Investors can access specific market benchmarks on deal EV/EBITDA multiples, value creation, loss rates, returns, CAGR, and more. These sub-sector level comparables enable investors to rigorously challenge investment proposals from GPs and mitigate risk more effectively within their co-investment programs.
-
Strategic Allocation Planning: Construct comparative analyses in the platform based on historical returns, invested capital, deal counts, and pricing within specific sectors. DealEdge offers proprietary Bain insights that support an LP’s sector and fund strategy. This allows investors to monitor investment shifts over time across various sectors or geographies. Such intelligence is vital for strategic allocation planning in PE.
-
Seamless GP Benchmarking: Upload a GP’s track record by fund and deal, utilizing a secure data room for data capture and automated analytics to benchmark their performance against a peer set in the market. Track key metrics including returns (MOIC, IRR, DPI) and operating performance (Revenue CAGR, EBITDA CAGR, multiples, EBITDA margin). The platform also offers fund-level analyses looking at returns, distribution, and other specialized Bain analyses on fund performance.
-
Enhanced Research Capabilities: DealEdge’s tracks 20+ performance metrics and can be filtered by Bain’s proprietary PE taxonomy (570+ subsectors and 200+ geographies). Investors use the database to conduct advanced macro-analyses on PE valuations, portfolio risk, market performance over time, sector performance, and more. The platform’s diverse filters on cash flows and operating performance enable investors to pinpoint precise answers to key strategy questions, with data that cannot be found elsewhere.
Ready to see how top LPs are utilizing DealEdge?
Explore our success stories and case studies.
DealEdge covers market data from 1970 to the present, tracking nearly 50,000 deals.
By utilizing more granular asset-level benchmarks, investors can better align their strategies with funds and deals that match their risk tolerance, performance expectations, valuations, and overall investment objectives in the dynamic landscape of private equity.
Here is a breakdown of recommended key metrics, all available in DealEdge, and their strategic value:
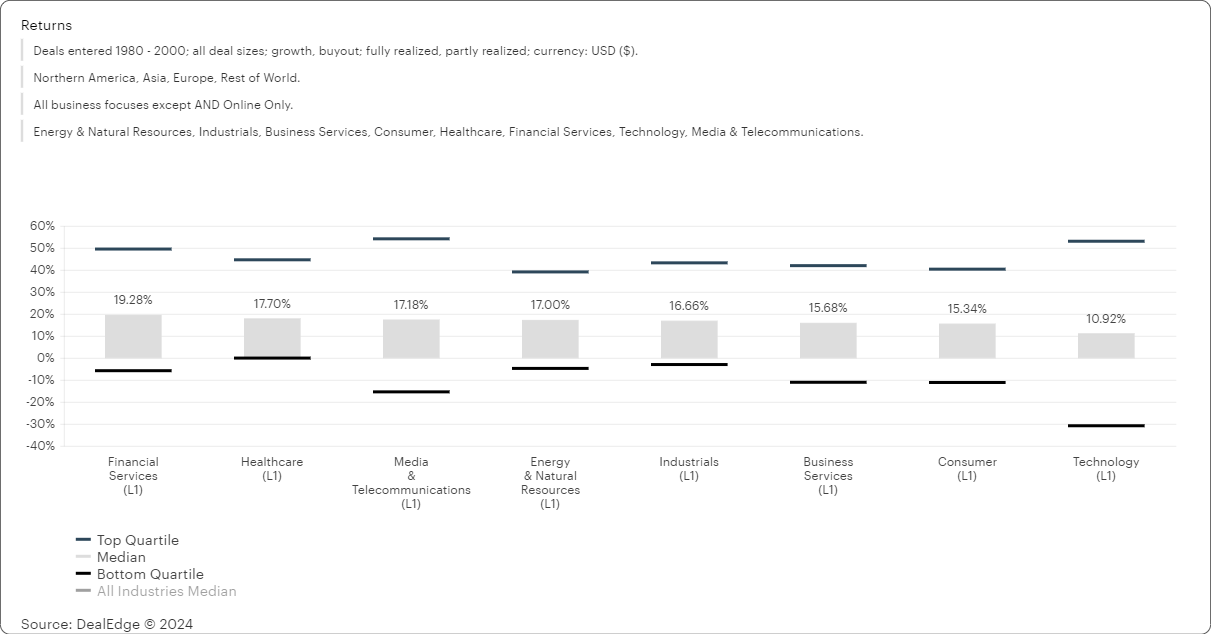
Internal Rate of Return (IRR):
- Strategic Value: IRR measures the annualized rate of return generated by an investment. It is crucial for assessing the profitability and efficiency of a deal over time. A higher IRR signifies better performance.
- Investor Reliance: Investors rely on IRR as it captures the time value of money and help them evaluate the attractiveness of potential returns, assisting in decision-making on new commitments.
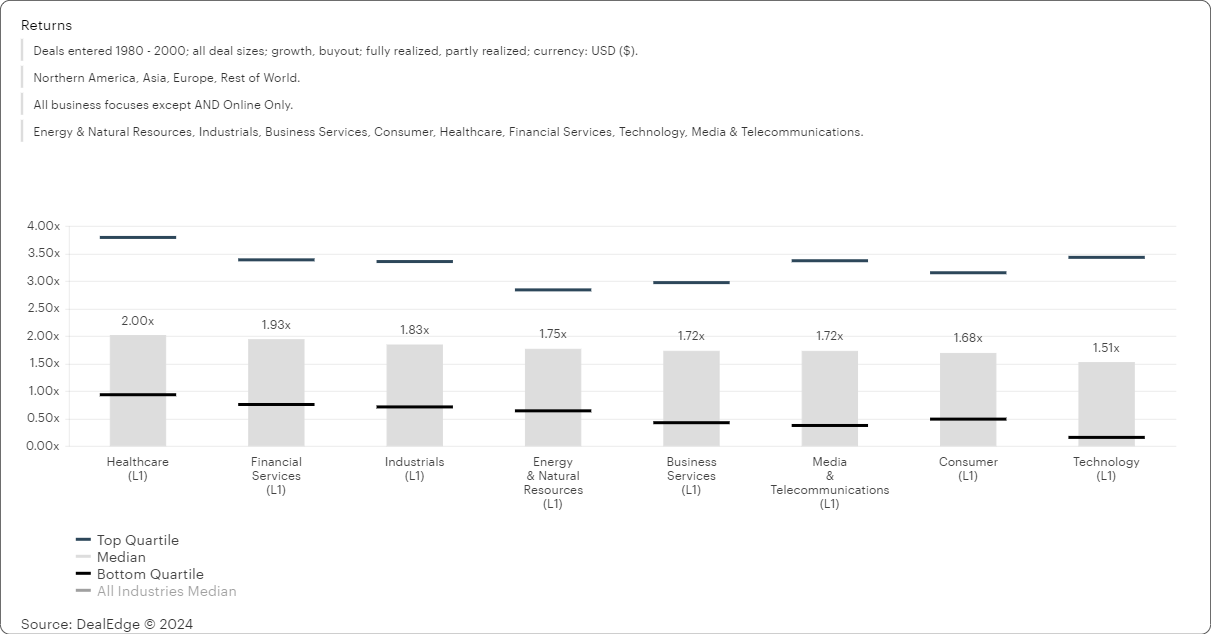
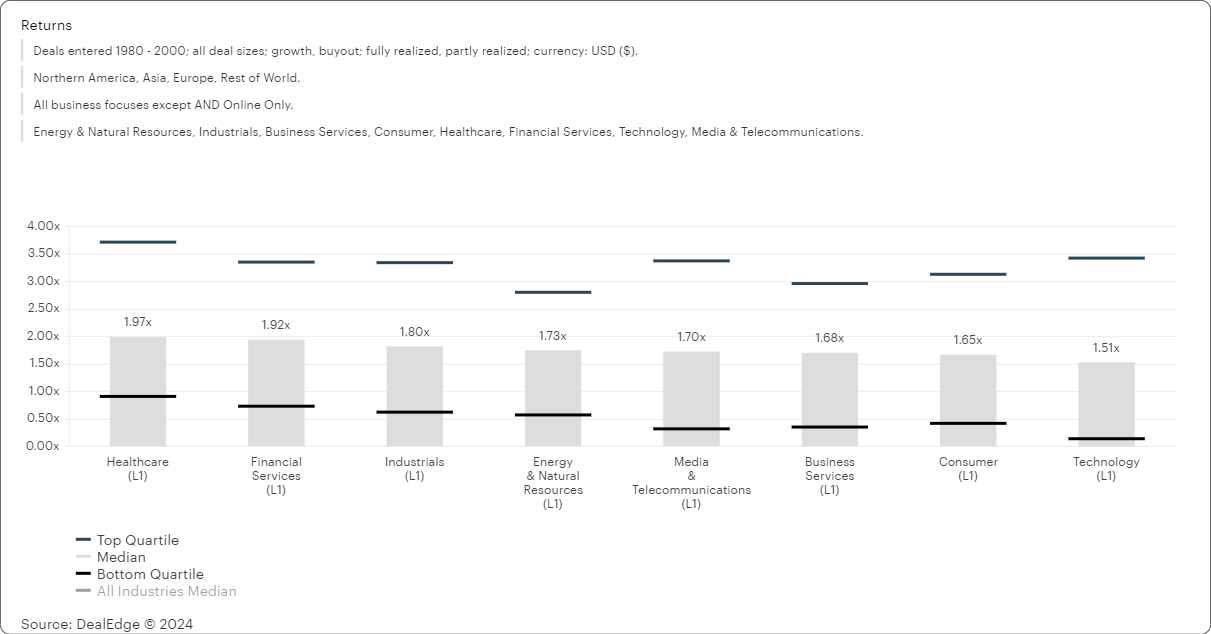
Multiple on Invested Capital (MOIC):
- Strategic Value: MOIC calculates the total value received relative to the initial investment. It provides insights into the fund's ability to generate returns and the efficiency of capital deployment.
- Investor Reliance: Investors rely on MOIC to gauge the fund's overall performance and its ability to deliver profitable exits, helping them assess risk-adjusted returns.
Distributed to Paid-In (DPI):
- Strategic Value: DPI represents the ratio of distributed cash to the total capital paid into the fund. It assesses the fund's success in returning capital to investors.
- Investor Reliance: Investors use DPI to understand the liquidity of their investments, helping them manage cash flows and make informed decisions on reinvestment or distributions.
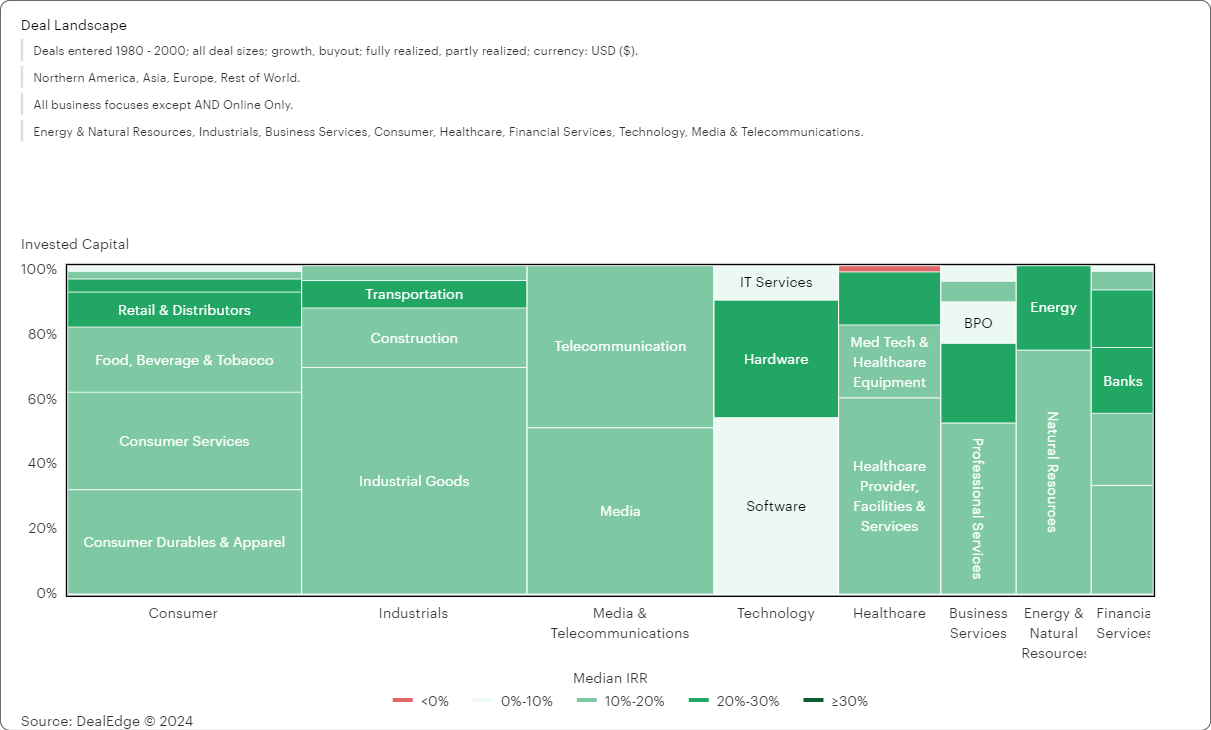
Deal Size, Deal Volume, and Growth:
- Strategic Value: The size and growth of capital invested in specific sub-sectors indicate how the market is trending and which types of deals are the most attractive.
- Investor Reliance: Investors rely on deal data to align their investment strategies with the right funds and market positioning, ensuring a strategic fit.
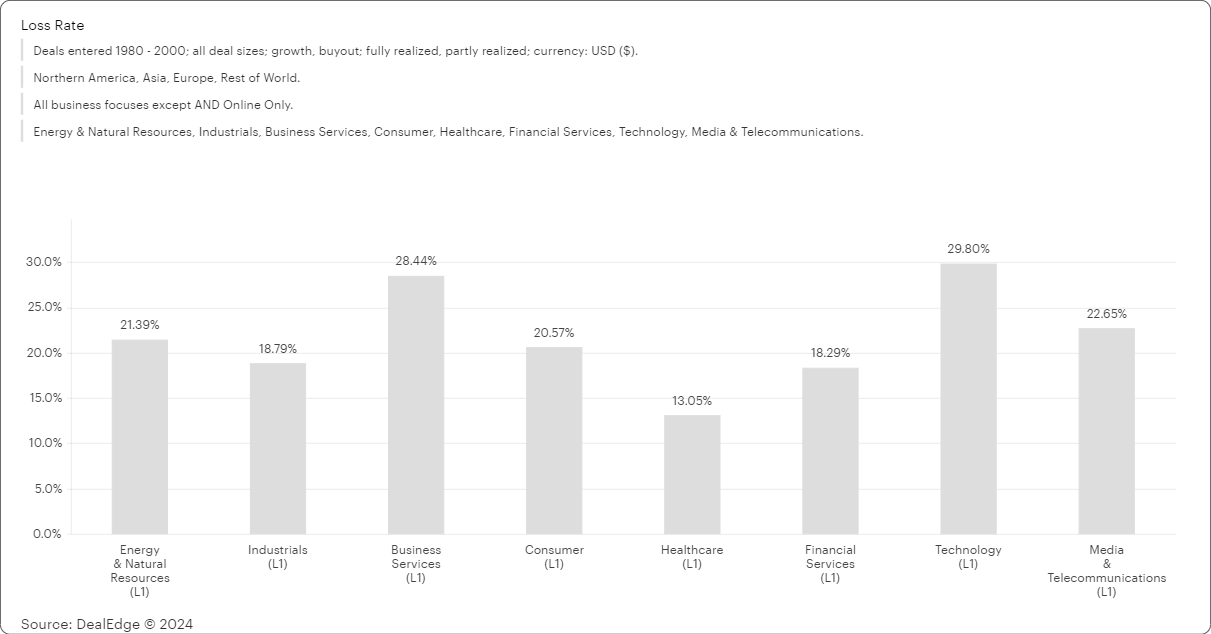
Loss Rate
- Strategic Value: Loss Rate measures the percentage of investments that result in a loss. This metric is critical for understanding the downside risk and overall risk management effectiveness of a fund. A lower Loss Rate indicates better risk mitigation and investment selection.
- Investor Reliance: Investors rely on Loss Rate to evaluate the risk profile of the fund. It helps them assess the likelihood of capital loss and the overall stability of their investment portfolio, guiding their risk tolerance and allocation decisions.
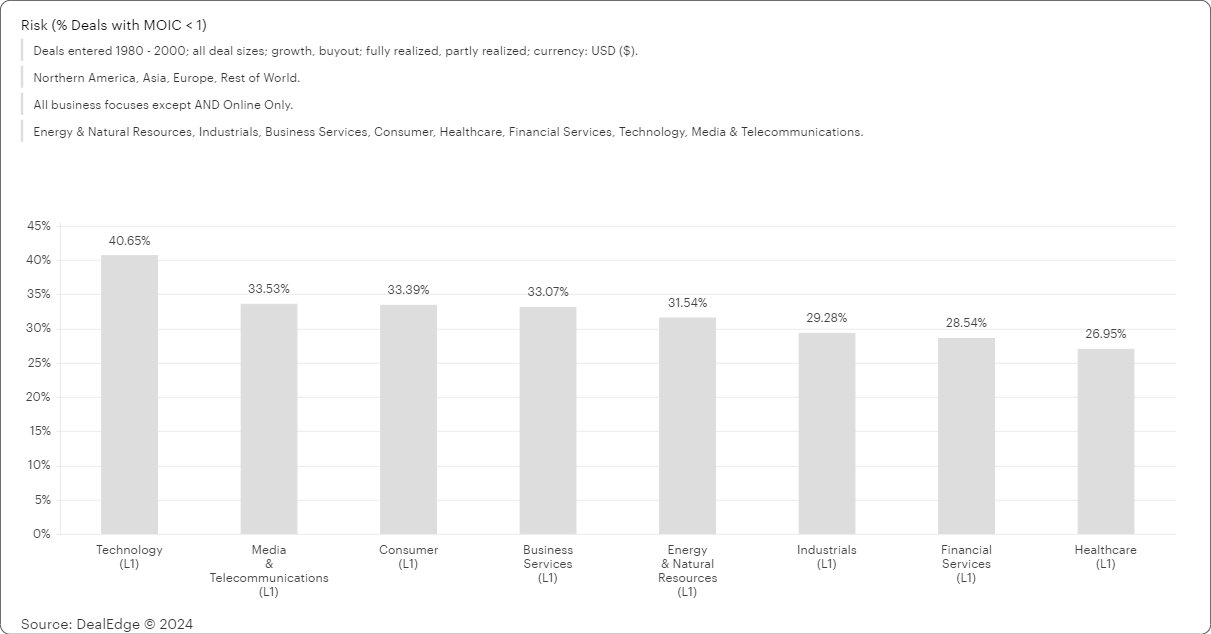
Risk (Percentage of Deals with MOIC < 1)
- Strategic Value: This metric indicates the proportion of investments that have not returned the capital invested (MOIC < 1). It is essential for assessing the risk management and investment quality within the fund. A lower percentage suggests better investment outcomes and risk controls.
- Investor Reliance: Investors use this risk metric to gauge the potential downside of their investments. It aids in understanding the frequency of underperforming deals and in making informed decisions about fund commitments and diversification strategies.
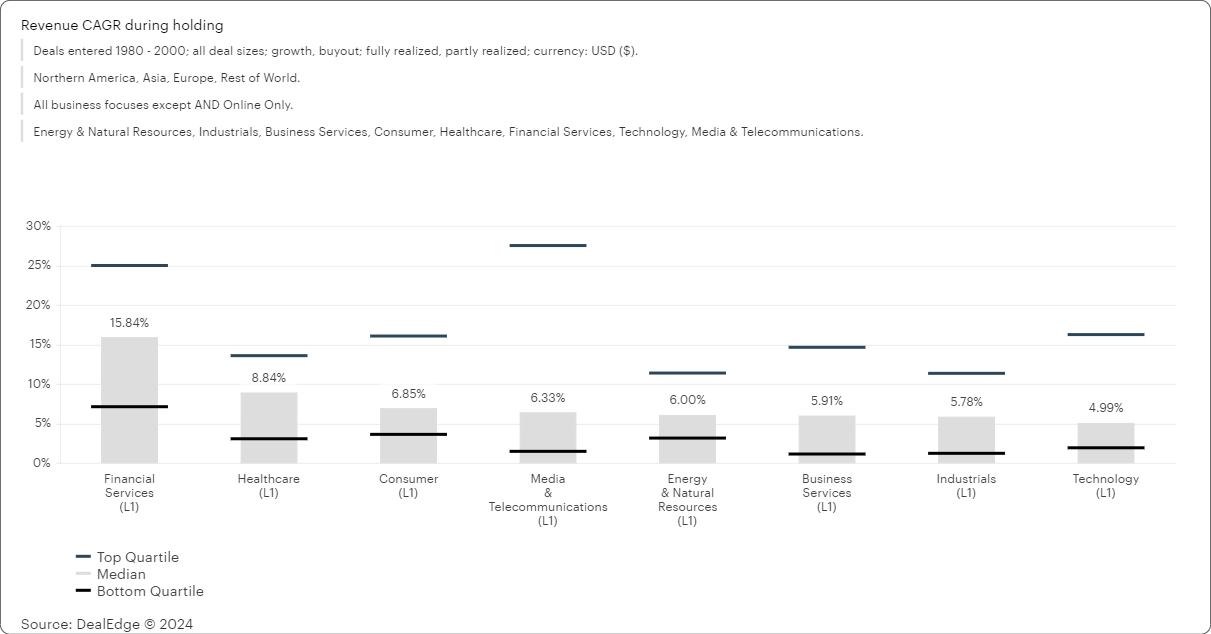
Revenue CAGR
- Strategic Value: Revenue Compound Annual Growth Rate (CAGR) measures the annualized growth rate of revenue over a specified period. It is a key indicator of the portfolio companies' growth and the fund's ability to drive top-line improvements.
- Investor Reliance: Investors rely on Revenue CAGR to assess the growth trajectory of portfolio companies. It helps them understand the potential for future returns and the effectiveness of the fund’s growth strategies, influencing their confidence in long-term value creation.
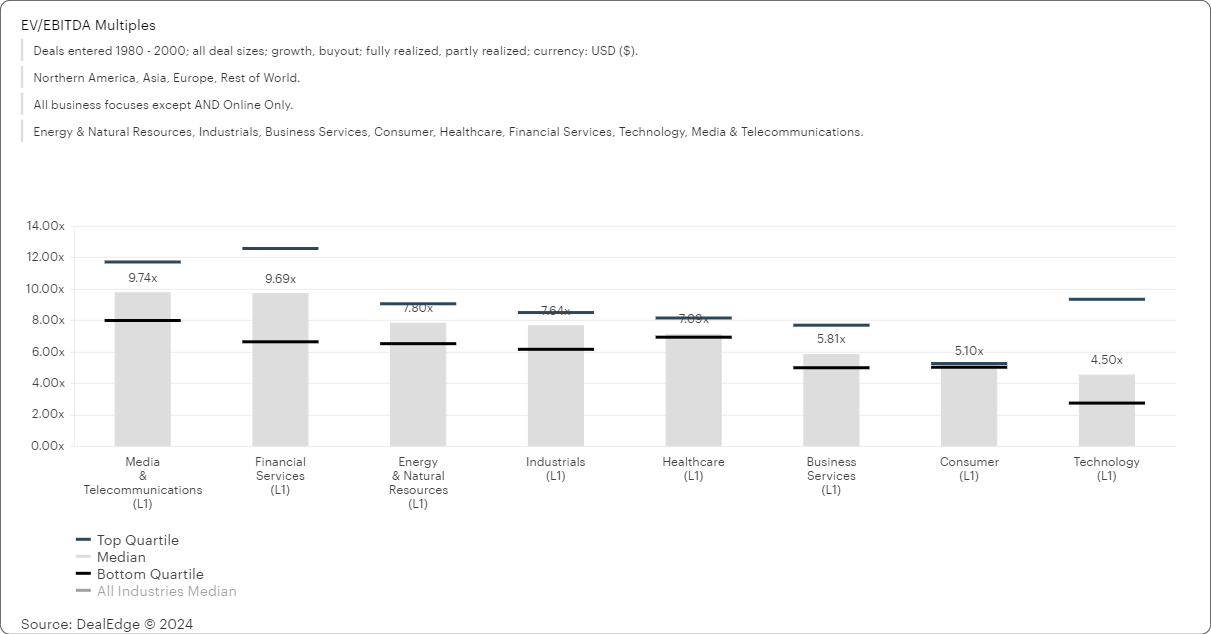
EBITDA Multiples
- Strategic Value: EBITDA multiples indicate the valuation of portfolio companies relative to their earnings before interest, taxes, depreciation, and amortization (EBITDA). This metric is crucial for assessing market valuations and the potential for profitable exits.
- Investor Reliance: Investors use EBITDA multiples to evaluate the market positioning and relative valuation of investments. It assists them in benchmarking the fund’s performance against market standards and in making informed decisions on the valuation and timing of exits.
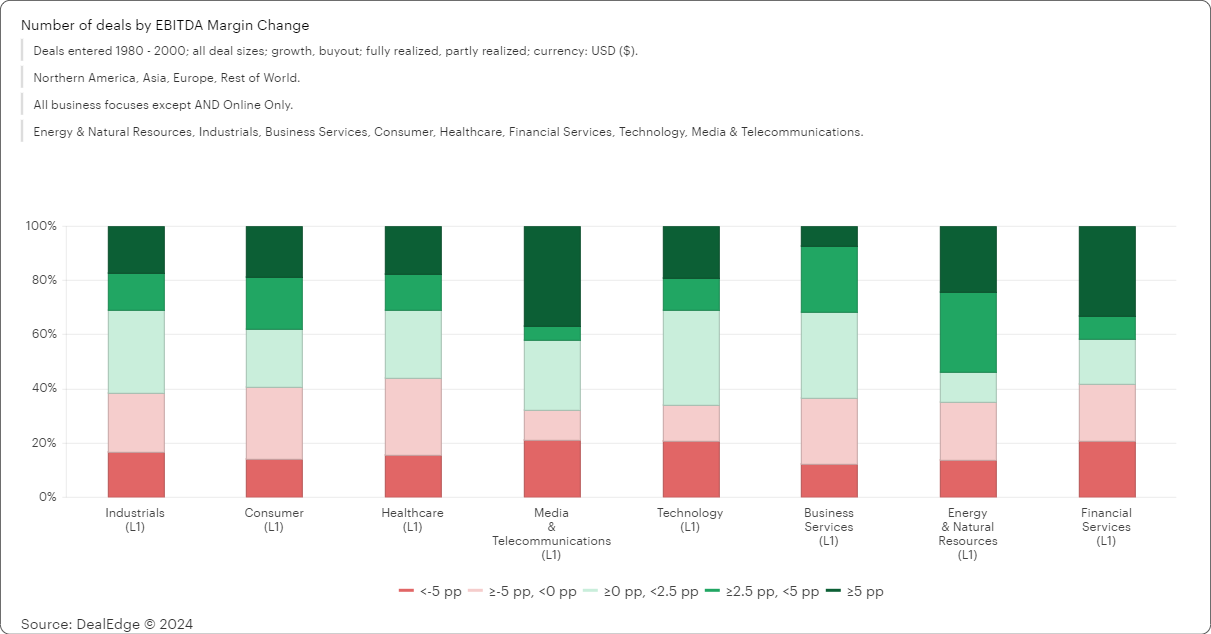
Number of Deals by EBITDA Margin Change
- Strategic Value: This metric tracks the number of deals categorized by the change in EBITDA margins. It is important for understanding the operational improvements and profitability enhancements achieved by the fund’s investments.
- Investor Reliance: Investors rely on this data to assess the operational effectiveness and value creation capabilities of the fund. It provides insights into how well the fund is improving portfolio company profitability, guiding expectations for future performance.
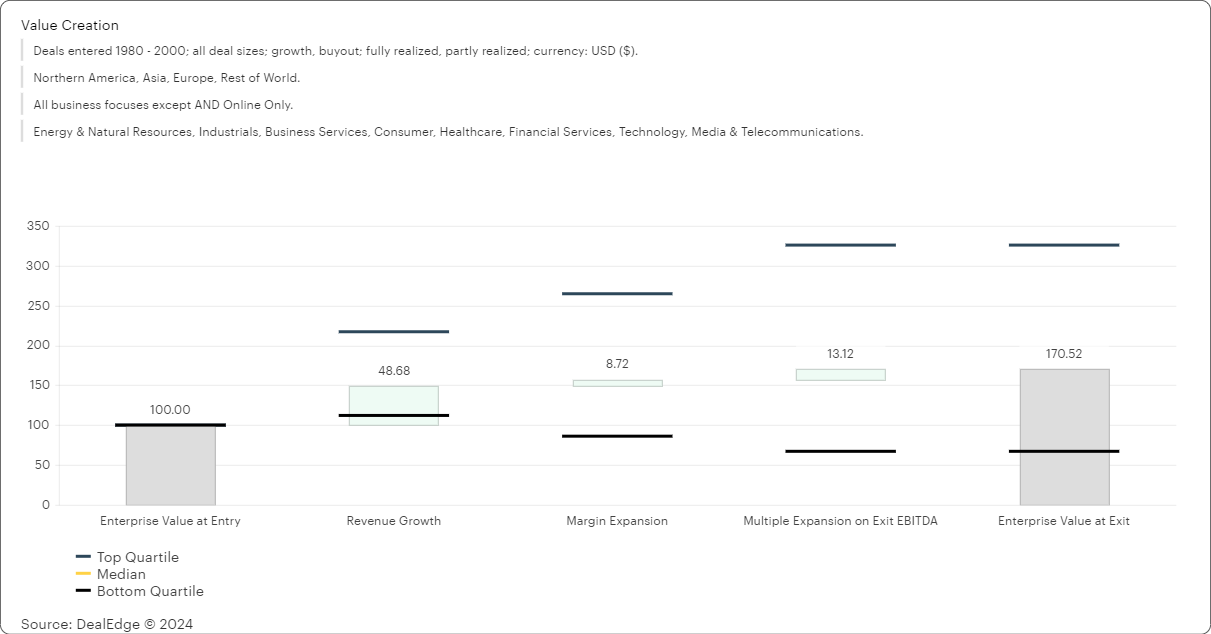
Value Creation Bridge
- Strategic Value: The Value Creation Bridge illustrates the sources of value creation in portfolio companies, breaking down contributions from revenue growth, margin expansion, multiple expansion, and other factors. It is essential for demonstrating the active management and strategic impact of the fund.
- Investor Reliance: Investors use the Value Creation Bridge to understand the drivers of returns in the portfolio. It helps them assess the fund's ability to generate value through different levers, reinforcing confidence in the fund’s strategic approach and management capabilities.
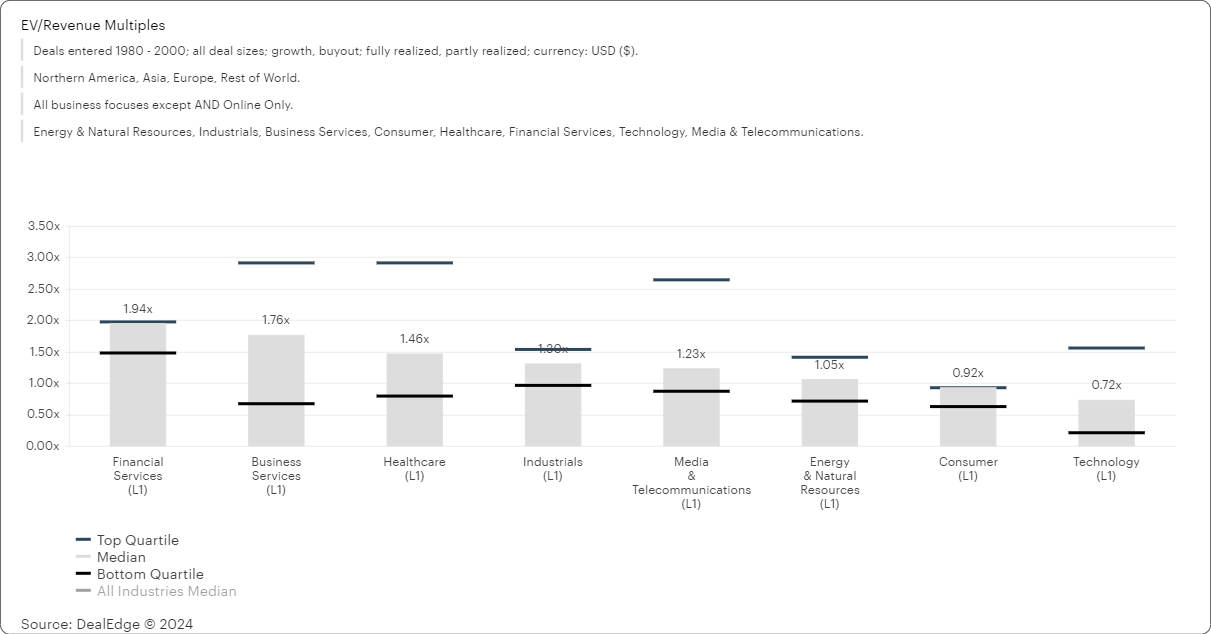
Revenue Multiples
- Strategic Value: Revenue multiples reflect the valuation of portfolio companies relative to their revenue. This metric is important for assessing the market’s perception of the companies' growth potential and the fund’s ability to achieve attractive valuations.
- Investor Reliance: Investors rely on revenue multiples to benchmark valuations and to understand the market dynamics affecting portfolio companies. It helps them evaluate the potential for value appreciation and the attractiveness of the fund’s investment strategy.
Supercharge Your Research and Strategy
Experience the power of DealEdge in action! Join us for a demo to witness firsthand how this innovative platform transforms data into strategic insights for investors and limited partners. Unlock the full potential of real-time portfolio monitoring, dynamic benchmarking, and efficient due diligence. Seize this opportunity to elevate your decision-making and optimize returns. Schedule your personalized demo now to embark on a journey towards more informed investments!
Sharpen your investment edge
Speak to us today and see how you can power up your private equity program
Request Demo
More from DealEdge


June 26, 2024