Snap Chart
Industrial Goods Deals Lead Sector Performance
Industrial goods and construction deals post IRRs in line with all-sector median, while transportation deals lag behind
Snap Chart
Industrial goods and construction deals post IRRs in line with all-sector median, while transportation deals lag behind
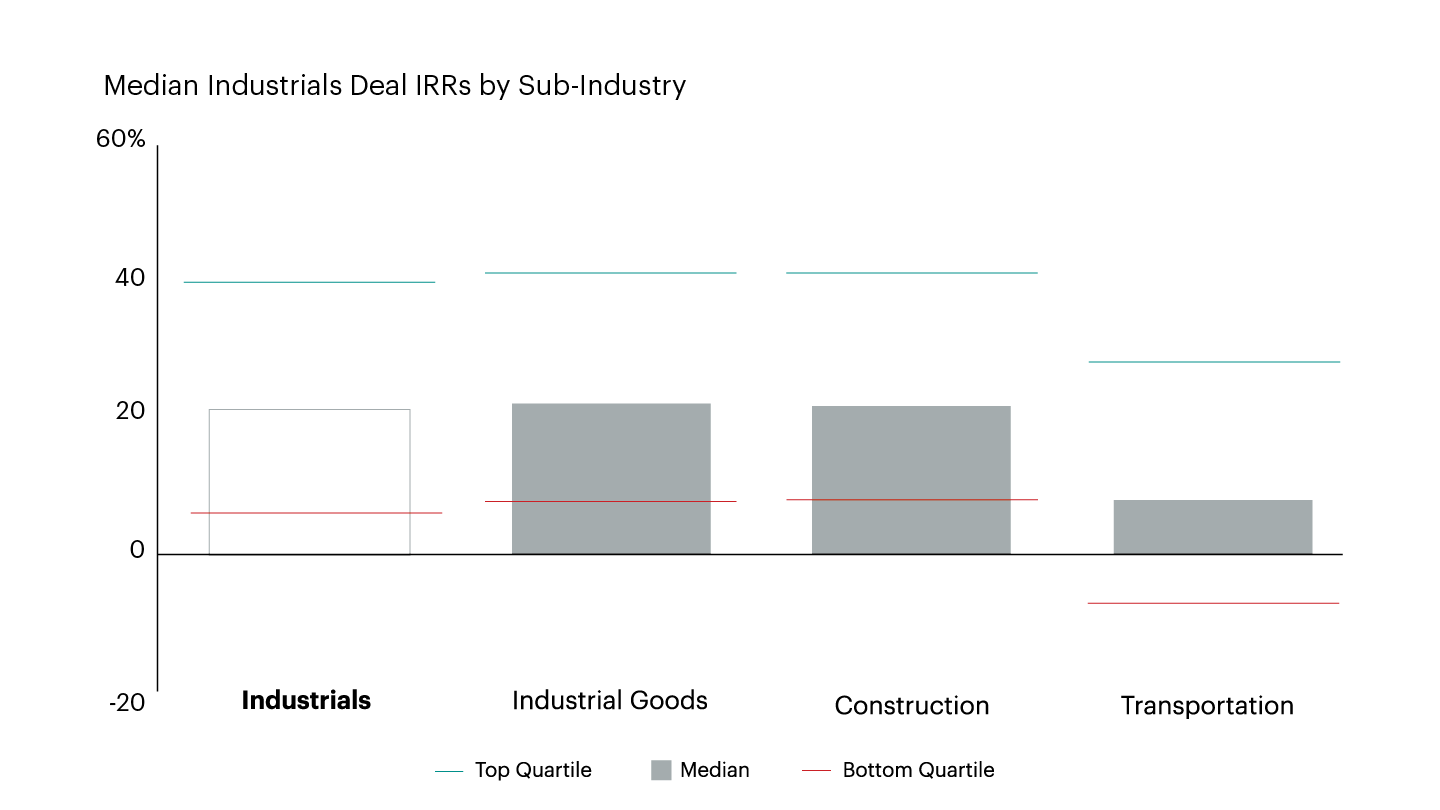

Notes: Median Industrials Private Equity Deal IRR Performance by Sub-Industry (buyout and growth deals, fully and partly realized, all sizes and locations, investment year 2010-2021). Data compiled as of October 2021.
Source: DealEdge Data Book: 2021 Private Equity Deal Performance BenchmarksRegister your details to receive DealEdge insights, analysis and updates directly to your inbox
This analysis is based on findings from the DealEdge Data Book: 2021 Private Equity Deal Performance Benchmarks
The median IRR for Industrials deals entered since 2010 is on par with the DealEdge All-Industry Private Equity Deal Benchmark – 20.5% and 21.9% respectively. There is similar parity at the top and bottom quartiles: the boundaries for Industrials deals remain within three percentage points of the All-Industry Benchmark in both instances.
The largest industry groups in the Industrials sector are consistent. Deals in Industrial Goods and Construction have posted median returns of 21.7% and 20.6% respectively, and have similar quartile boundaries. But Transportation deals have historically seen significantly lower median IRRs – just 7.9% for deals entered in 2010-2021. This has in turn had a dampening affect on the sector-level Industrials benchmark.
For more sector-level breakdowns of private equity deal performance, download your free copy of the DealEdge Data Book today:


