Snap Chart
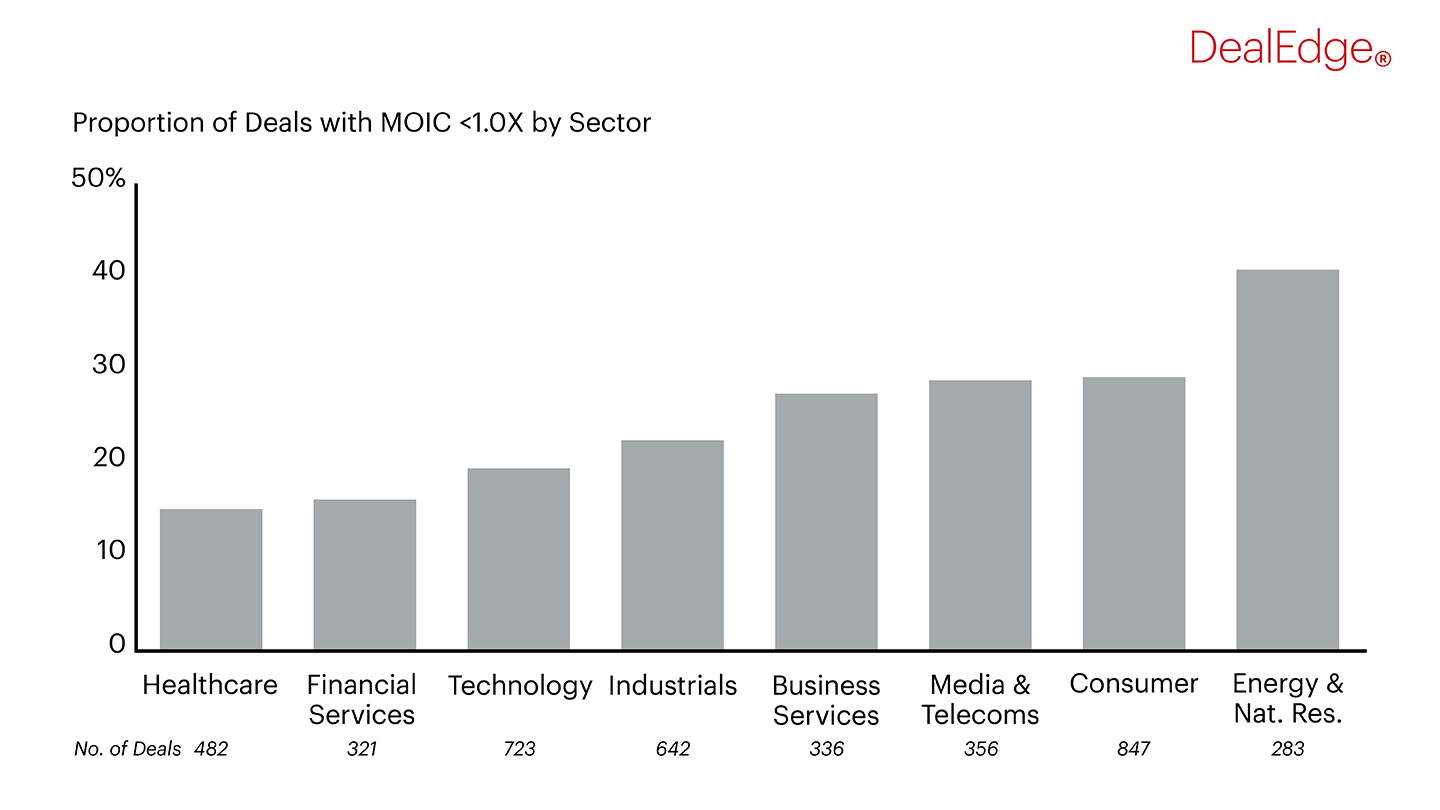
Private equity loss rates vary by sector
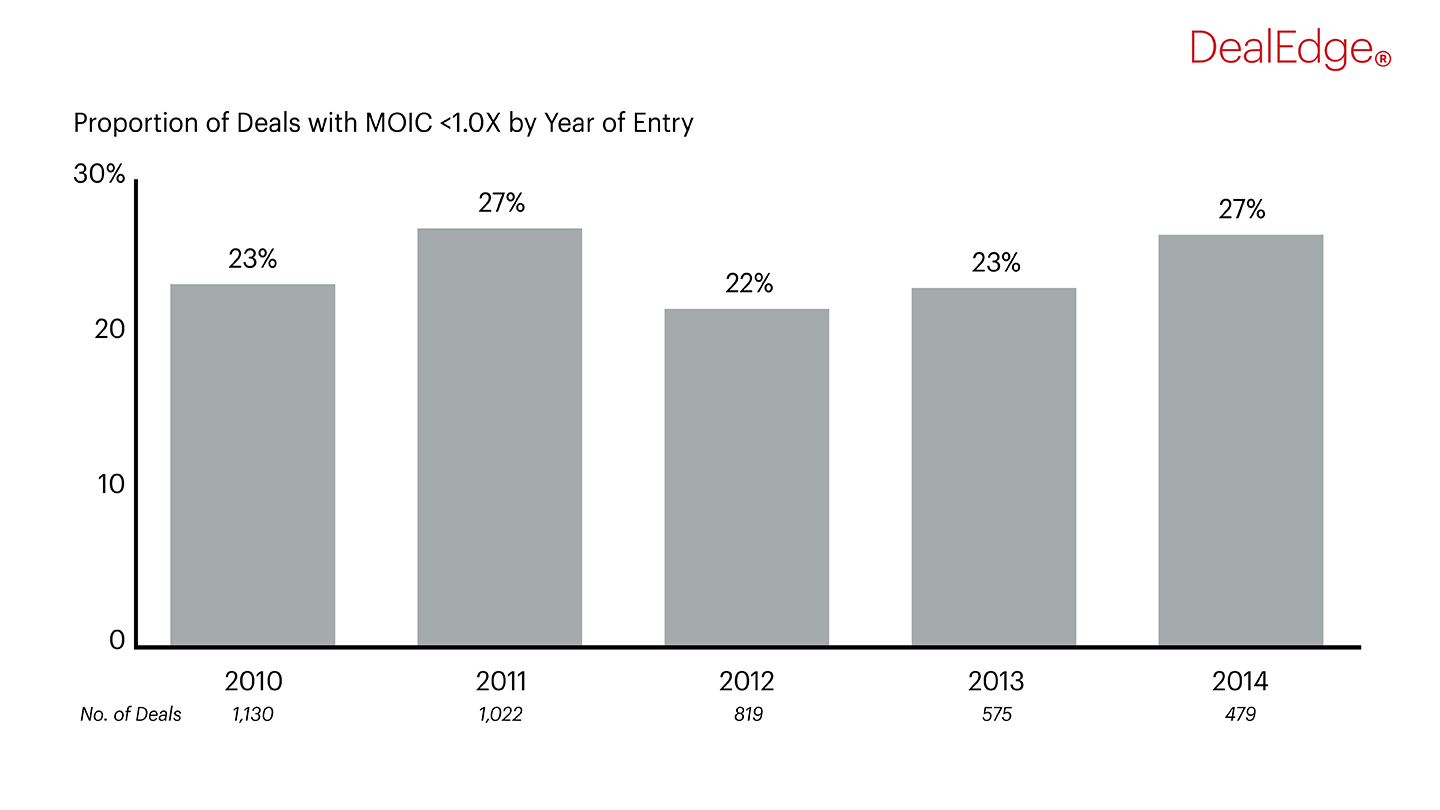
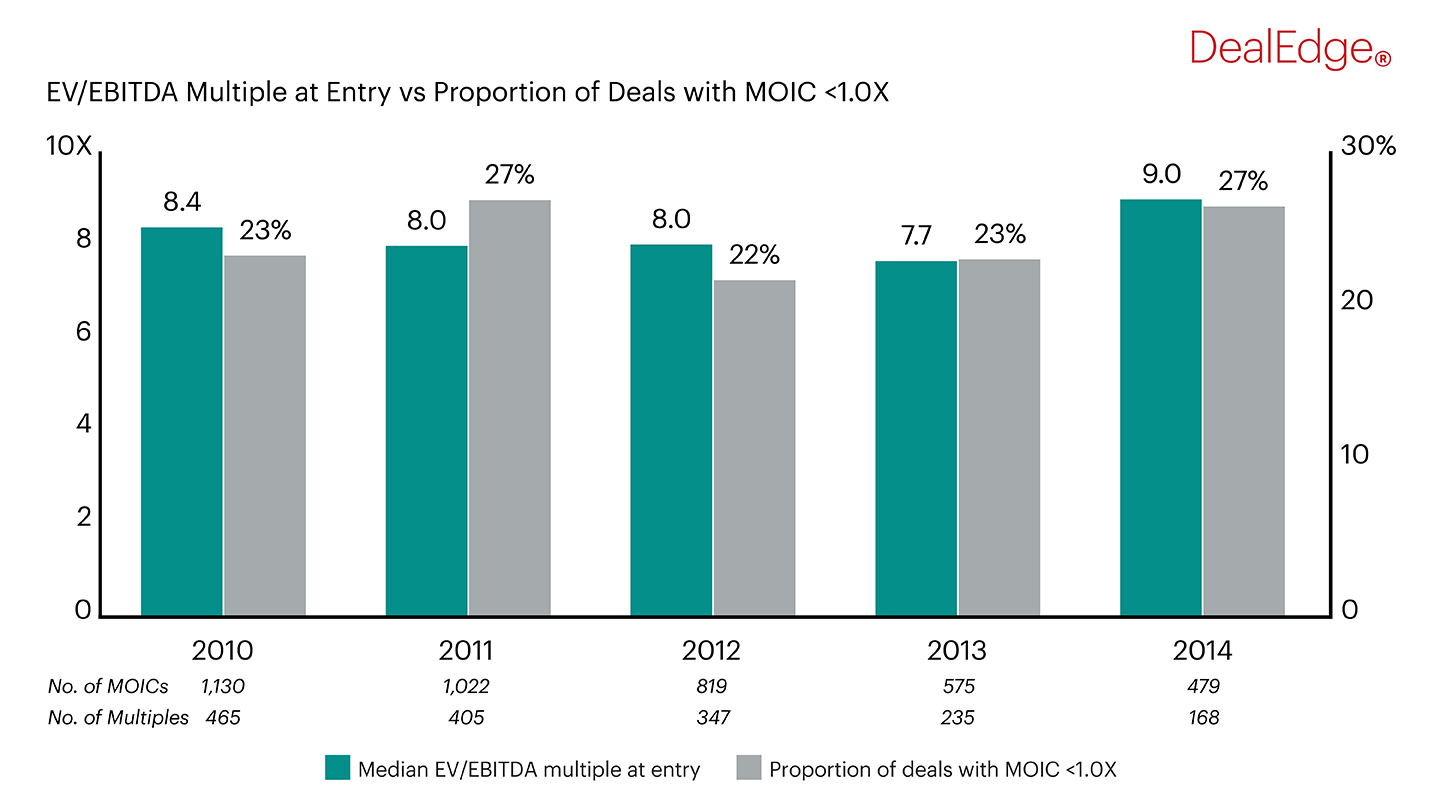
Using the loss rates analytics on DealEdge, we explore how the proportion of deals with MOICs less than 1.0X is related to pricing and sector in the entry years 2010-2014
Snap Chart
Using the loss rates analytics on DealEdge, we explore how the proportion of deals with MOICs less than 1.0X is related to pricing and sector in the entry years 2010-2014


Notes: Proportion of deals with MOIC less than 1.0X by year of entry: buyout and growth deals; fully realized; all sizes; all regions; all sectors; year of entry 2010-2014; all figures calculated in USD
Source: DealEdge

Notes: Proportion of deals with MOIC less than 1.0X vs median EV/EBITDA multiple at entry: buyout and growth deals; fully realized; all sizes; all regions; all sectors; year of entry 2010-2014; all figures calculated in USD
Source: DealEdge

Notes: Proportion of deals with MOIC less than 1.0X by sector: buyout and growth deals; fully realized; all sizes; all regions; all sectors; year of entry 2010-2014; all figures calculated in USD
Source: DealEdge

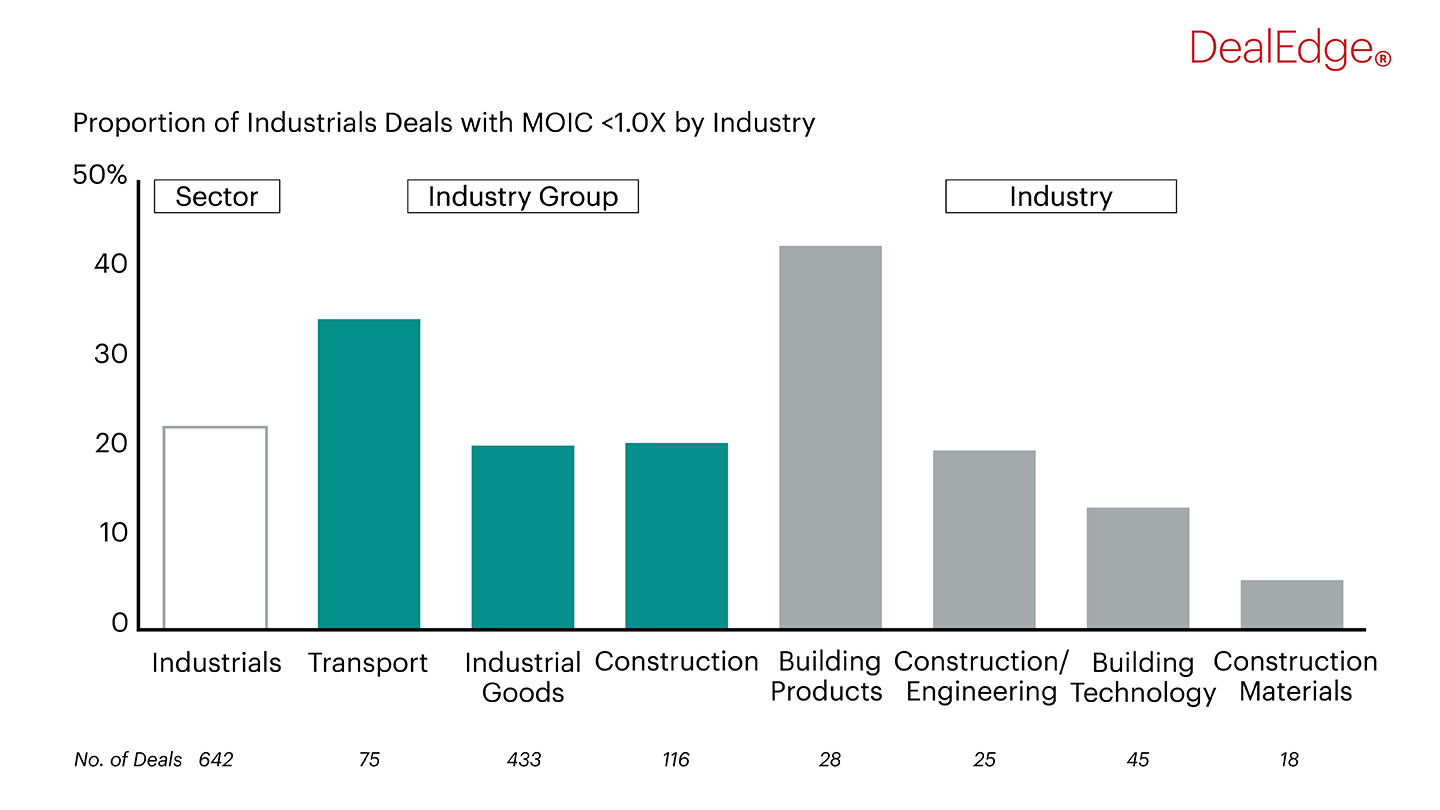
Notes: Green bars denote industry groups within Industrials, while grey bars denote industries within Construction. Proportion of Industrials deals with MOIC less than 1.0X by industry: buyout and growth deals; fully realized; all sizes; all regions; all sectors; year of entry 2010-2014; all figures calculated in USD
Source: DealEdgeDeveloping a winning strategy doesn’t just involve assessing upside potential, but also downside risk. This is particularly true in the face of a market downturn.
DealEdge tracks a range of private equity risk metrics across more than 570 industry subsectors, including:
To examine the downside risks in your area of focus, speak to us today.