Blog
How high inflation affects private equity investment is a complicated question. But the industry has undergone previous periods in similar environments. To offer a case study into how historic deals have performed in these circumstances, we look at private equity deal returns during the previous historic period of high inflation: 1989-91.
Sign up to DealEdge insights
Register your details to receive DealEdge insights, analysis and updates directly to your inbox


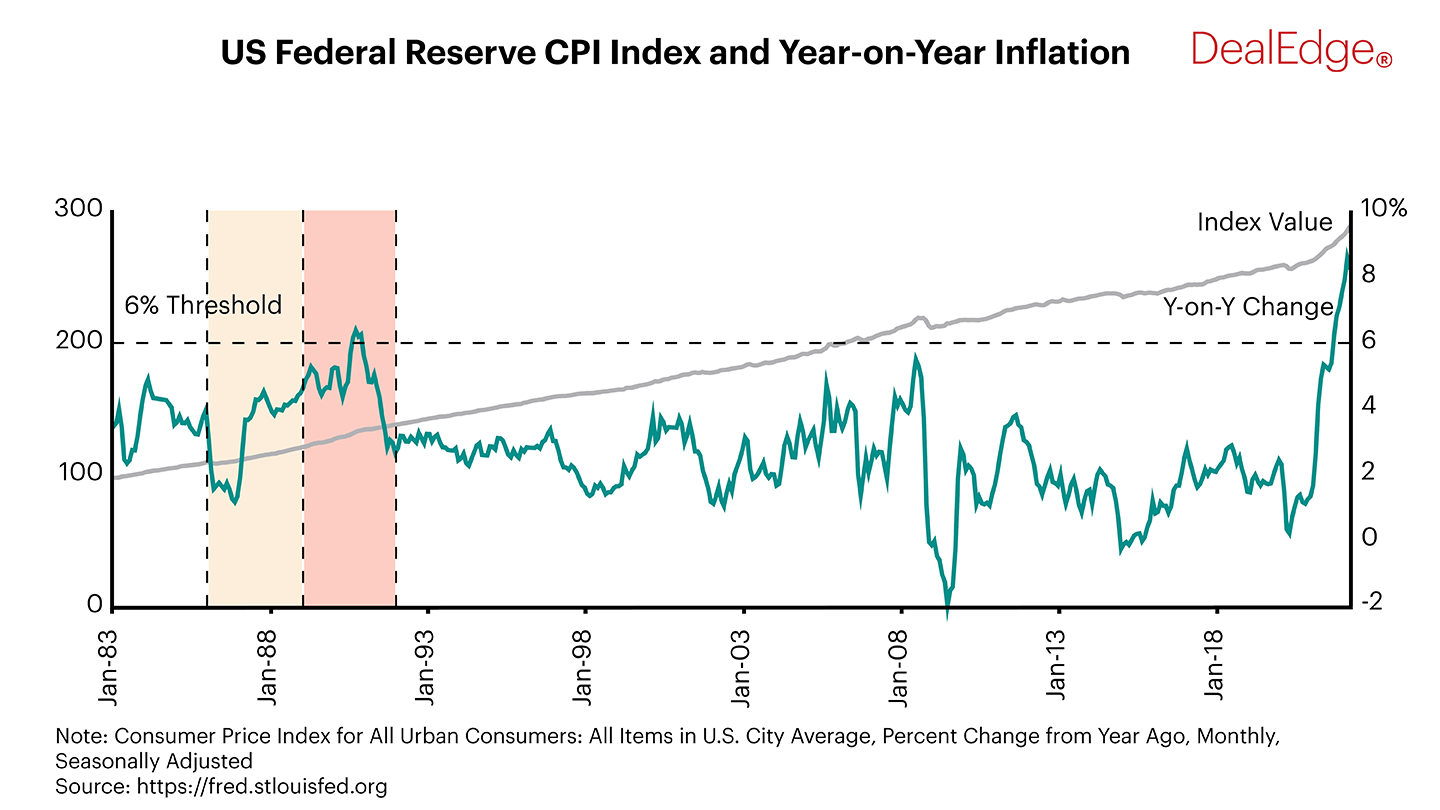
- Using US Federal Reserve data, we identified the last time inflation reached 6%, in late 1990. We further identified two phases: a pre-inflation period in 1986-88, and a high-inflation period in 1989-91.
- We then examined the returns of US private equity deals entered during these two phases, to see how high inflation affected performance in the industry.
Get the full performance picture with the DealEdge Data Book: Private Equity Deal Performance Benchmarks
Download now


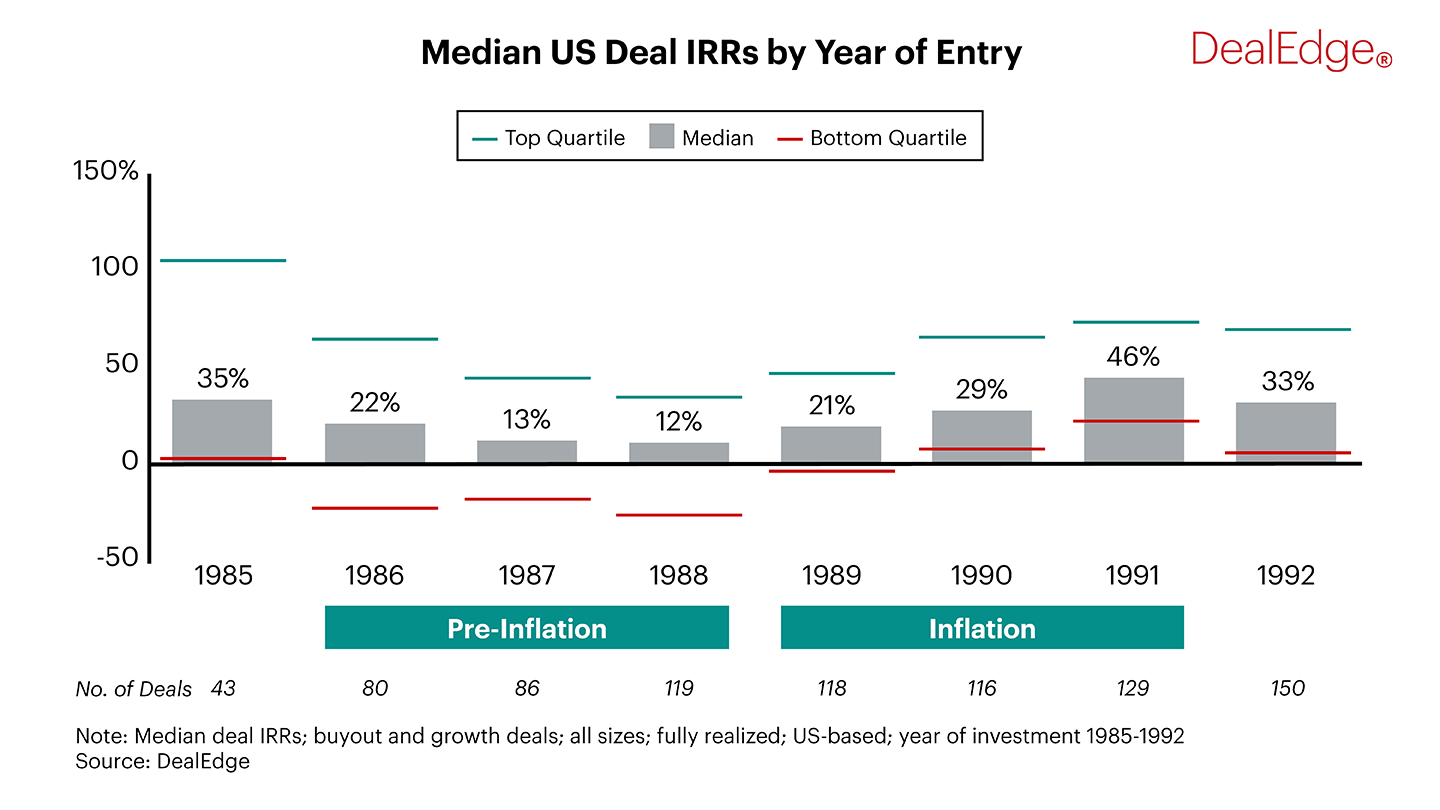
- Deals entered in 1986-88 had generally lower median IRRs than their counterparts entered in 1989-91. In fact, median returns in 1991 were more than twice as high as in 1986.
- Returns fell across most quartiles from 1986-88, before climbing successively to 1991. Bottom quartile returns did not exceed negative 15% at all in the pre-inflation period.
- The difference between the top and bottom quartiles was mostly consistent throughout, ranging from 50 to 62 percentage points across 1987-1991. Deals made in 1986 saw a much wider spread of 87pp.
Read the second part of our case study where we continue to look at the previous high inflation period of 1989-91 to examine the drivers behind the overall performance picture.
Want to cut the data exactly the way you need? Break down performance and value creation by size, region, sector, and more with DealEdge. Get a demo today:
Sharpen your investment edge
Speak to us today and see how you can power up your private equity program
Request Demo


